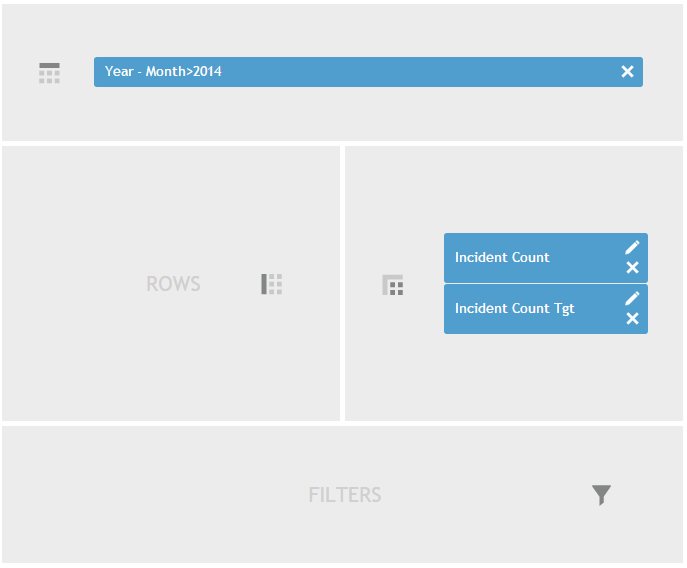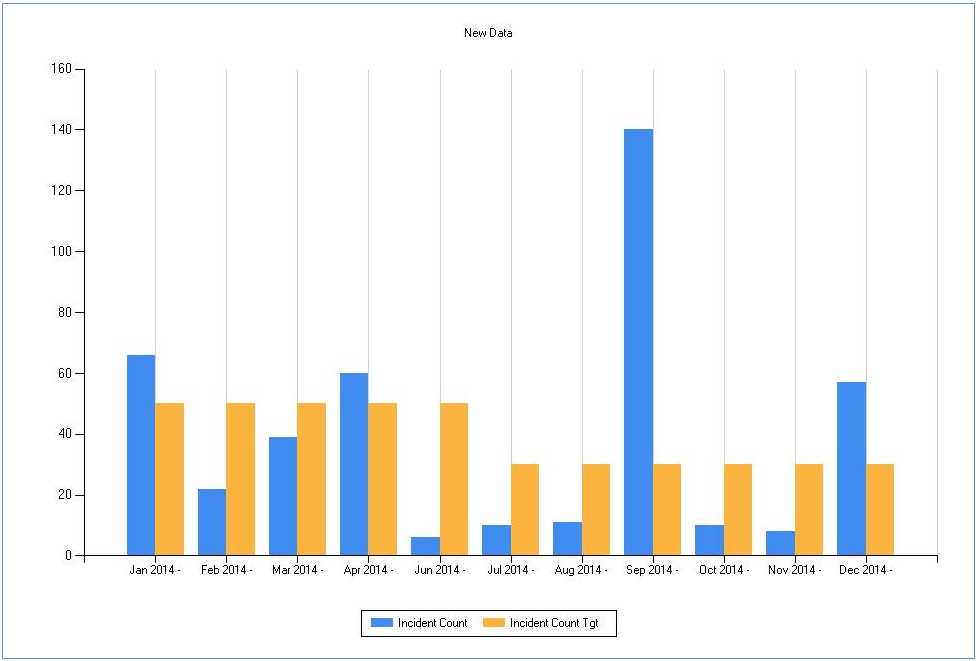
The Data Cube supports the visualization of multiple measures in the same Data view. This allows comparison Data views to be generated and is particularly useful when you would like to compare measures. For example, you may have an “Incident Count Target” custom measure for which values have been manually provided through the Custom Metrics module. In the Data and Graph views, you can visually compare that to the incident count.
This Construction view:

Will generate this Data view:

And this Graph view:
